Agent Quality Coverage
Not "we have 347 evals", but how much of your agent's real production behavior do your golden tests check?
Agent Quality Coverage is one number with a drill-down, on the Coverage page and the Dashboard:
Agent Quality Coverage 50% = 35% × Risk 61% + 25% × Traffic 60% + 25% × Failure 25% + 15% × Behavioral 50%
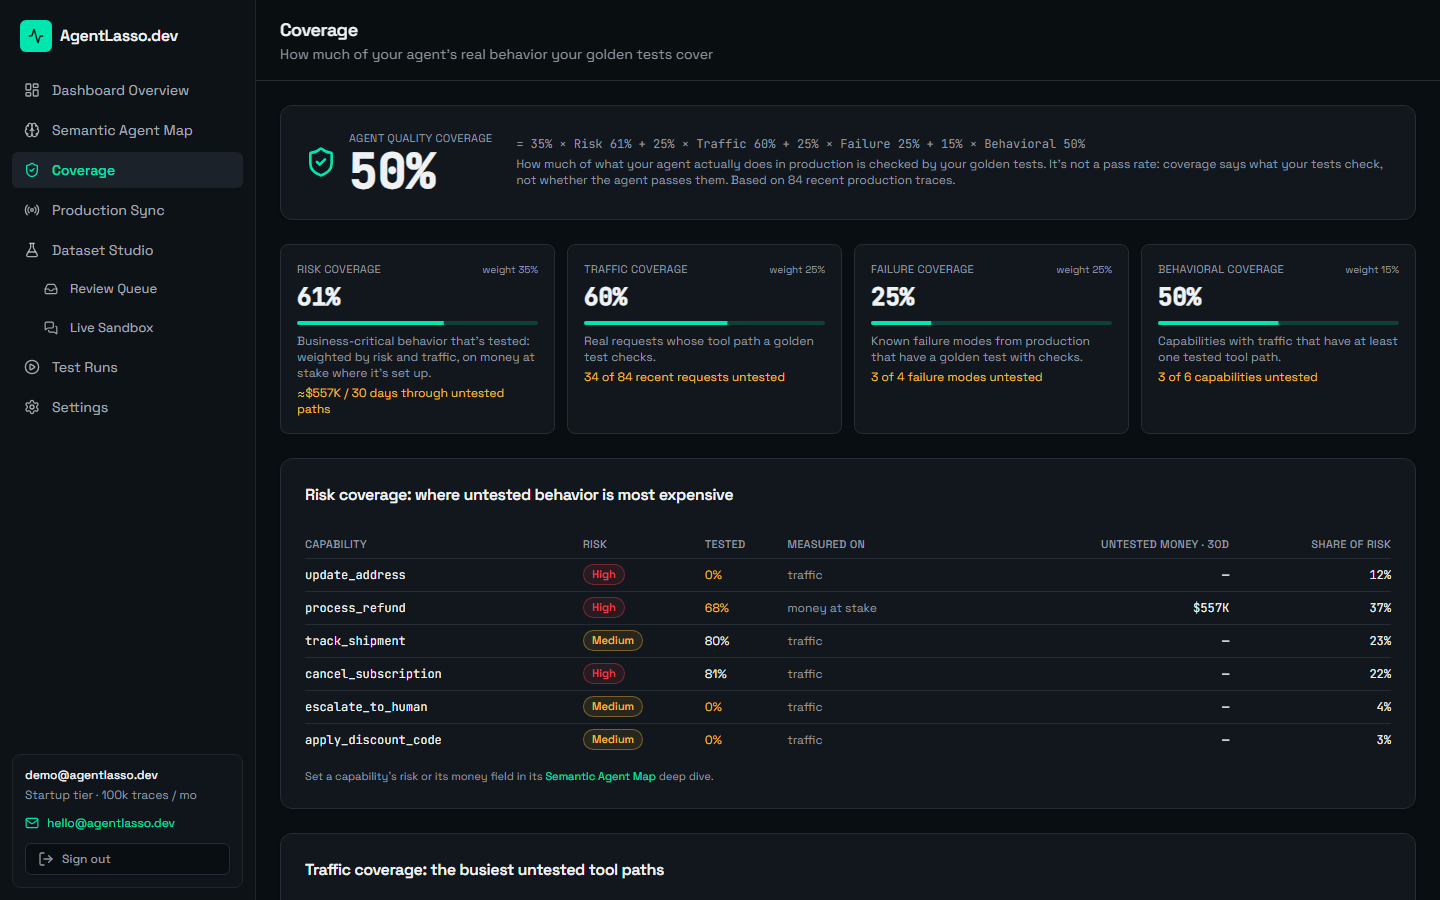
Coverage says what your tests check, not whether your agent passes them. A fully covered agent can still fail its tests; that's what CI is for.
How a tool path counts as tested
Coverage is measured on tool paths: the tools a trace called, in order, e.g. orders.lookup → stripe.refund. A golden test case with at least one check covers a path when any of these is true:
- the test was created from a production trace that took exactly this path;
- the test expects tools (
Tool must be called,Tools called in this order), all of them occur on the path, and every other tool on the path only reads data. Lookups needn't be asserted, but anything that changes something must be; - the path calls no tools, and the test expects none (e.g. a refusal test).
So a refund test covers orders.lookup → stripe.refund, but not orders.lookup → stripe.refund → shippo.create_label ("refund and send a replacement"): creating the shipment is untested behavior. Paths are compared as sets of tools; order isn't compared.
A test case without checks covers nothing: it verifies nothing.
The four parts
Traffic coverage (weight 25%)
The share of recent production requests whose tool path a golden test checks.
Risk coverage (weight 35%)
The same idea, weighted by what an untested gap costs:
- Each capability counts in proportion to its traffic × risk (high 3, medium 2, low 1).
- Within a capability, coverage is measured on money at stake when a money field is confirmed: the share of its money flowing through tested paths. Otherwise it's measured on traffic.
The drill-down lists capabilities by how much untested risk they carry, with untested money where it's known.
Failure coverage (weight 25%)
The share of known failure modes that have a golden test. A failure mode is a group of production traces flagged as failures or edge cases, grouped by capability and failure type: prompt injection, ambiguous multi-intent request, escalation to a human, unmatched request, and so on.
A failure mode is covered when a golden test with checks was created from one of its traces. A test without checks is shown as Test has no checks: it exists, but verifies nothing.
Behavioral coverage (weight 15%)
The share of capabilities with traffic that have at least one tested tool path. It's the coarsest part, so it has the lowest weight.
The headline
A weighted average of the four parts, with the weights shown next to the number. A part with nothing to measure yet (for example, no flagged failures) is left out, and the other weights scale up proportionally, rather than counting as 0% or 100%.
Closing gaps
Each drill-down lists exactly what's missing, with a way to fix it:
- Busiest untested tool paths: each comes with a real example request. Approve one of its traces in the Review Queue, or add a test case whose checks assert the tools that change something on that path.
- Untested failure modes: approve one of its traces in the Review Queue, then add checks in the rubric editor.
- Capabilities with no tested path: add test cases for them in Dataset Studio.
- Risk: set each capability's risk and money field in its Semantic Agent Map deep dive, so coverage weighs what matters most.
The Semantic Agent Map's Top priorities panel ranks the same gaps per capability. Coverage updates as soon as you add checks.
Limits
- Coverage is computed from your recent traces (up to the 1,000 most recent the app loads). The page says how many it's based on.
- Coverage history over time is not available yet.